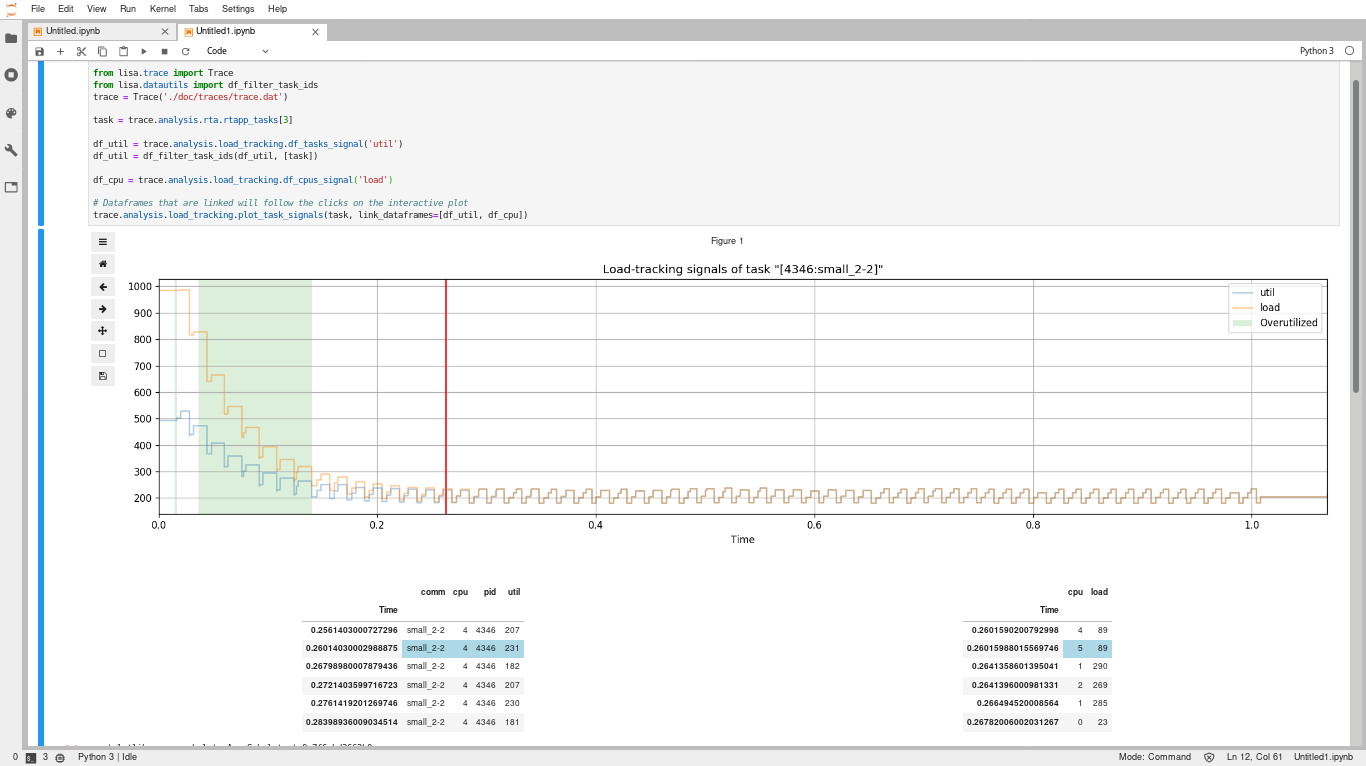
Allow interactive df display linked to a plot widget
That should solve the long standing annoyance of going back and forth between kernelshark and the notebook when one needs to look at the exact events in a dataframe at a given time:
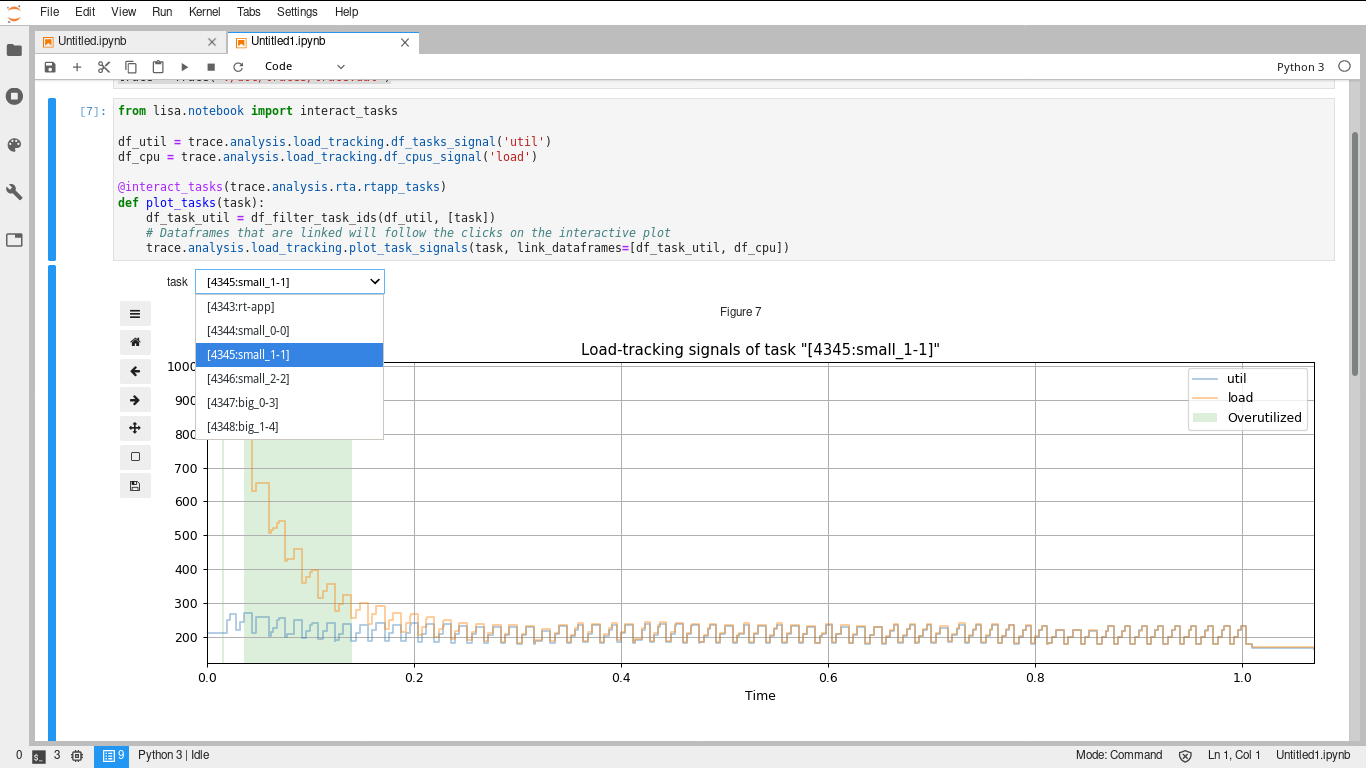
For good measure, also add an easy way to select the task to look at using a dropdown:
And to finish the basic UI, add an "open in kernelshark" button next to every figure that analysis plot methods touch:
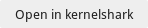
Kernelshark can unfortunately not zoom in the trace from the command line, it needs a session file that needs to contain lots of other info, and is a bit picky about what makes it happy and what makes it segfault.